Advanced Features
Usage Data Dashboard
Gain insights into your chatbot's usage data across various integration sources with the analysis dashboard.
Analysis Dashboard
Access your Analysis dashboard via the URL https://www.chat-data.com/chatbot/{chatbotId}/dashboard/analytics. This dashboard provides insights through lots of aggregated metrics:
- Conversations Number
- Messages Number
- Upvotes/Downvotes Number
- Leads Number
- Message Credit Usage
- Hourly Distribution of Chats (UTC Zone)
- World Distribution of Chats
- Topics of User Messages
All of these metrics are aggregated over the day and can show as a date timeline graph or a bar chart.
Important Insight
Please select the Source first to ensure the data displayed is streamlined and accurate.
Overview Statistics
The overview statistics section shows the total number of conversations, leads, messages, and message credits usage over the selected period. 
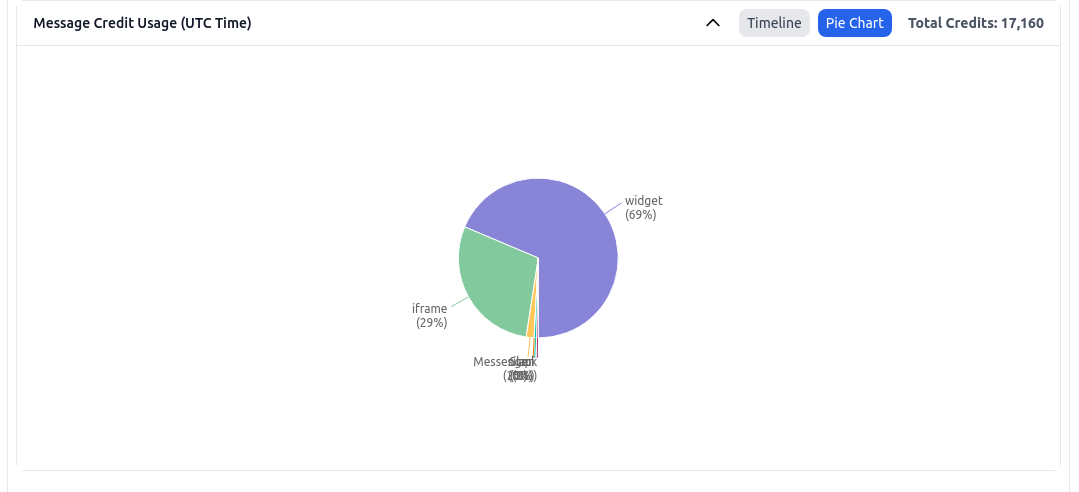
Message Credit Usage
This chart tracks the usage of message credits by your chatbot, displayed on a daily basis over the selected period.
Timeline

Bar Chart
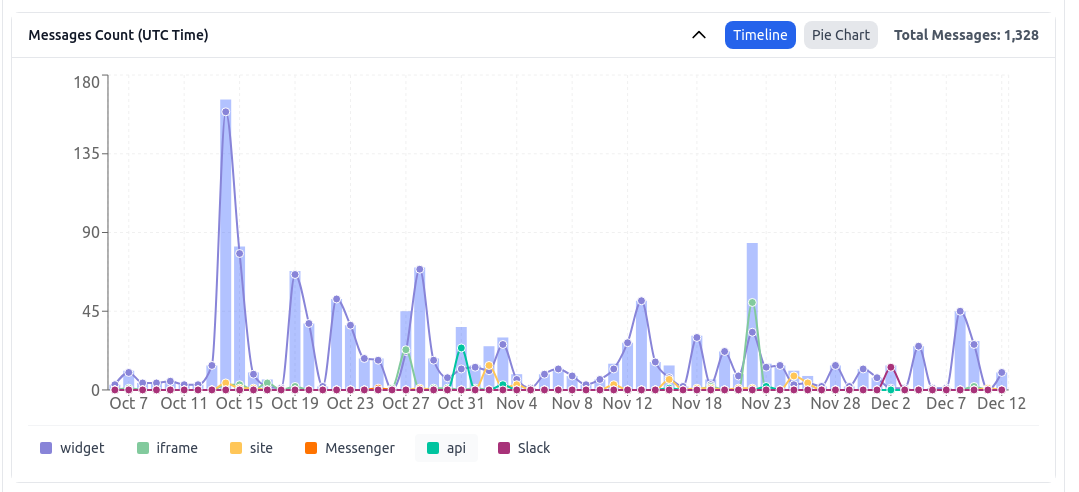
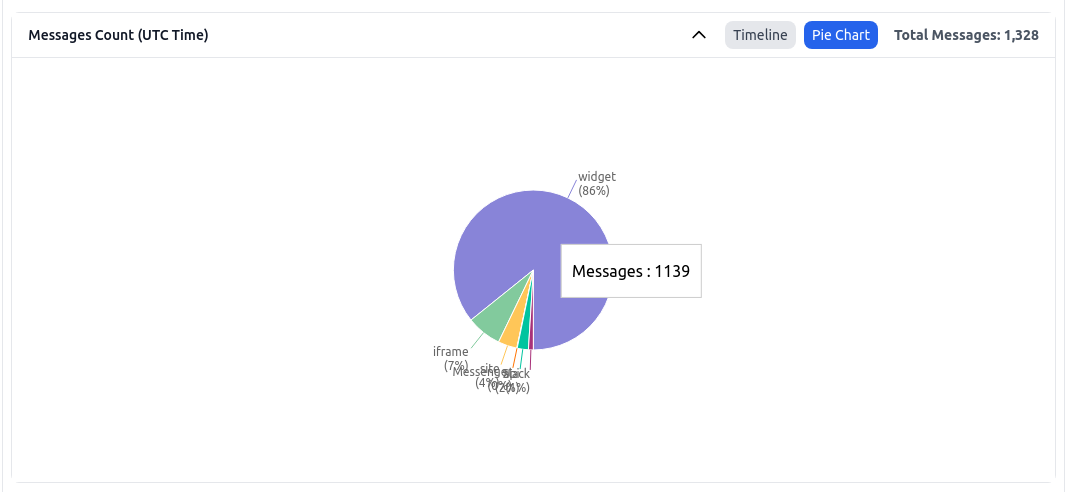
Message
This chart tracks the user messages over the selected period.
Timeline
Bar Chart
Hourly Distribution of Chats (UTC Zone)
This graph illustrates the average distribution of chats throughout a day, segmented into hourly intervals over the selected period. 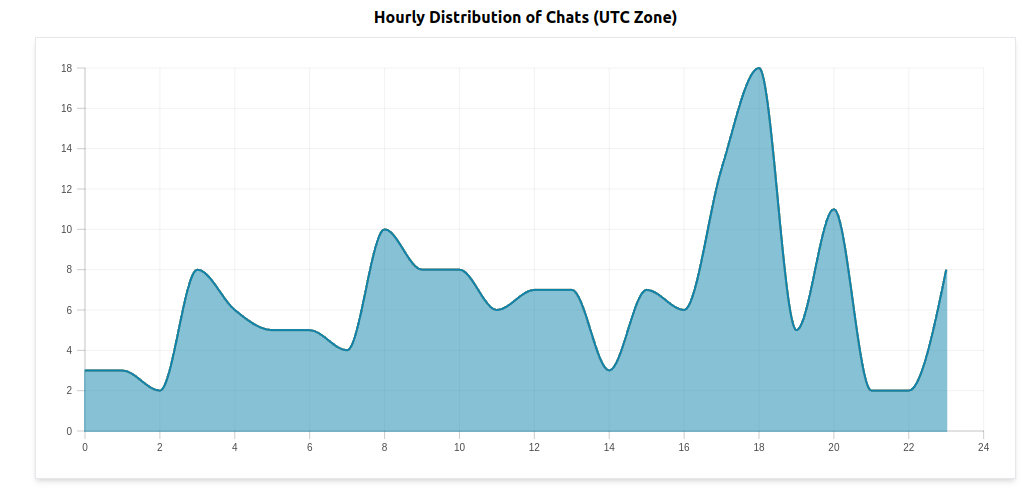
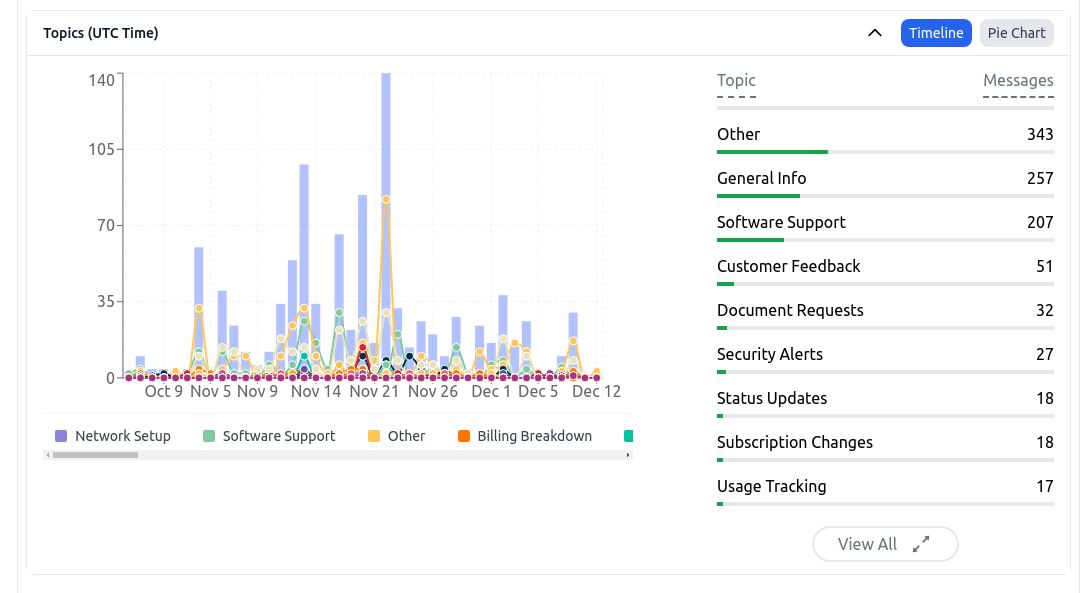
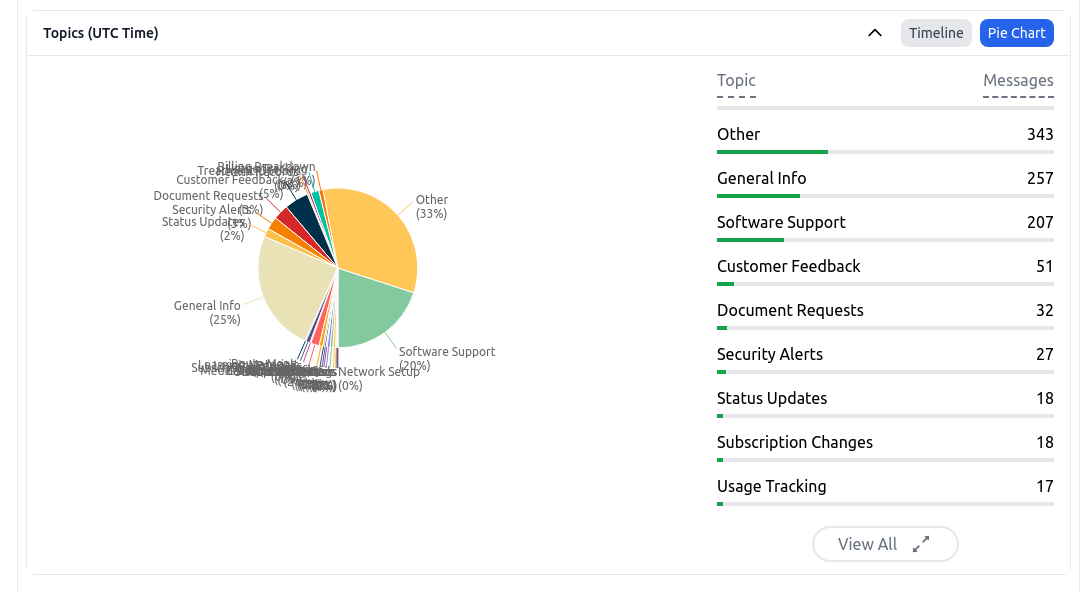
Topics of User Messages
This graph shows the topics of user messages over the selected period. By default, we have curated 50 topics from various industries. You can customize these topics in the Settings > Analysis tab to better match your business needs, which will improve the accuracy of topic classification. For more details, please check the Topics of User Messages page.
Timeline
Bar Chart
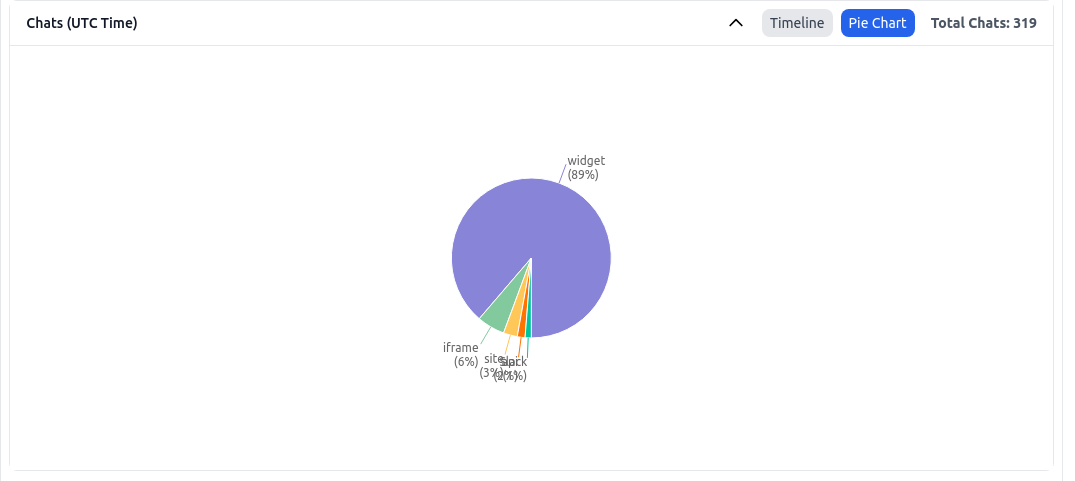
Chats
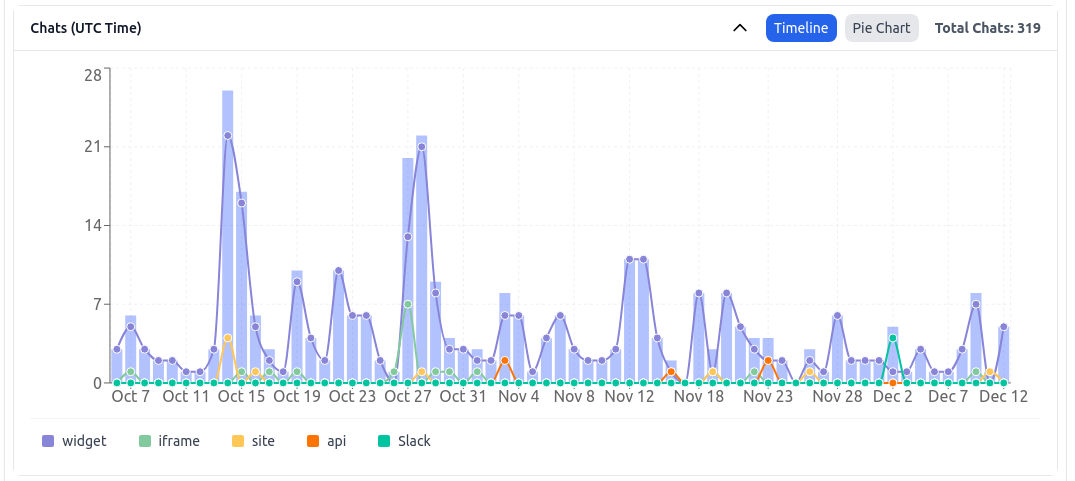
This graph shows the number of chats over the selected period. One chat is the conversation thread which contains multiple messages.
Timeline
Bar Chart
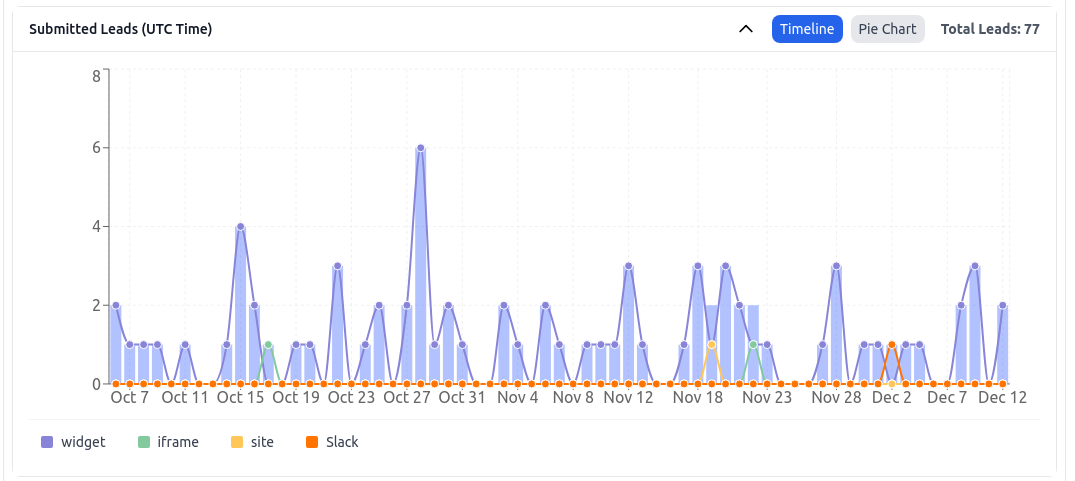
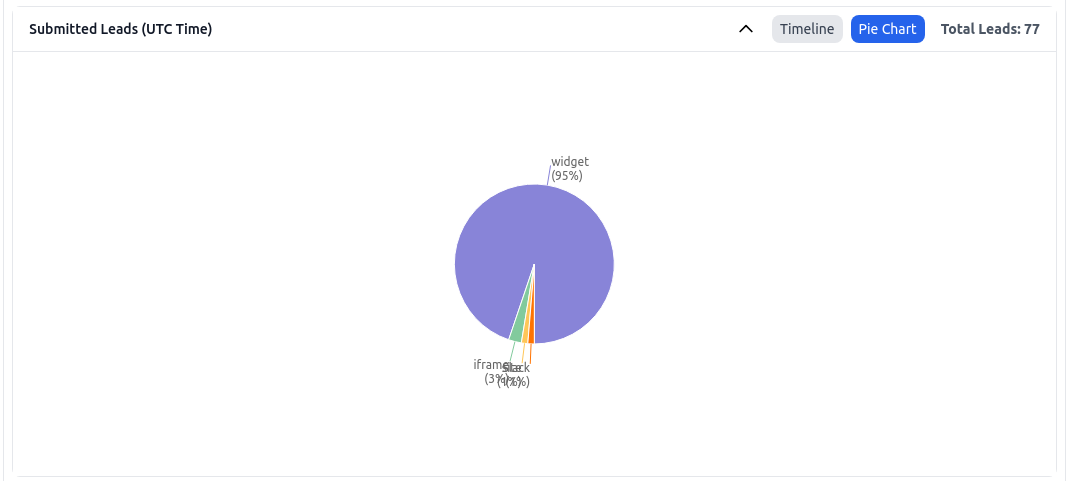
Leads
This graph shows the number of collected leads over the selected period. A lead is a user who submitted their information to your chatbot.
Timeline
Bar Chart
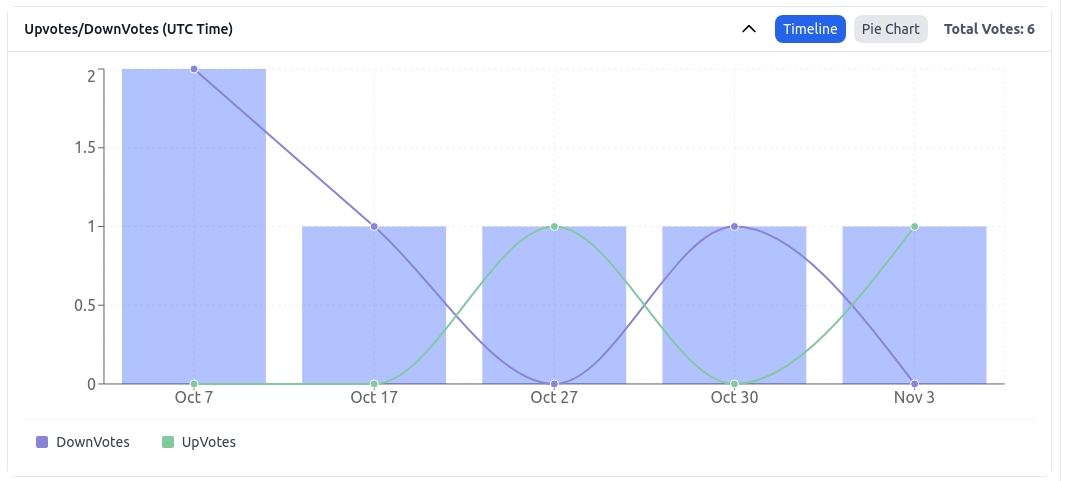
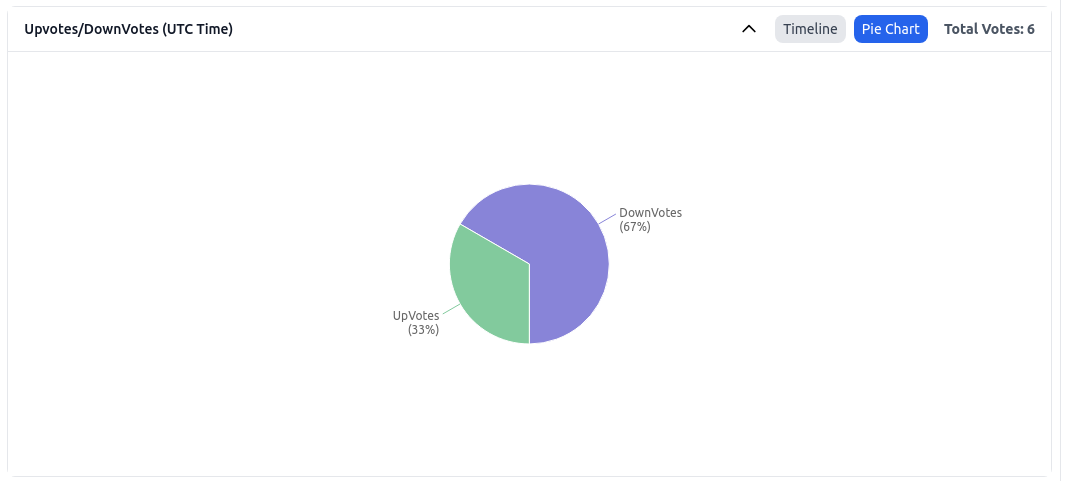
Upvotes/Downvotes
This graph shows the number of upvotes and downvotes over the selected period.
Timeline
Bar Chart
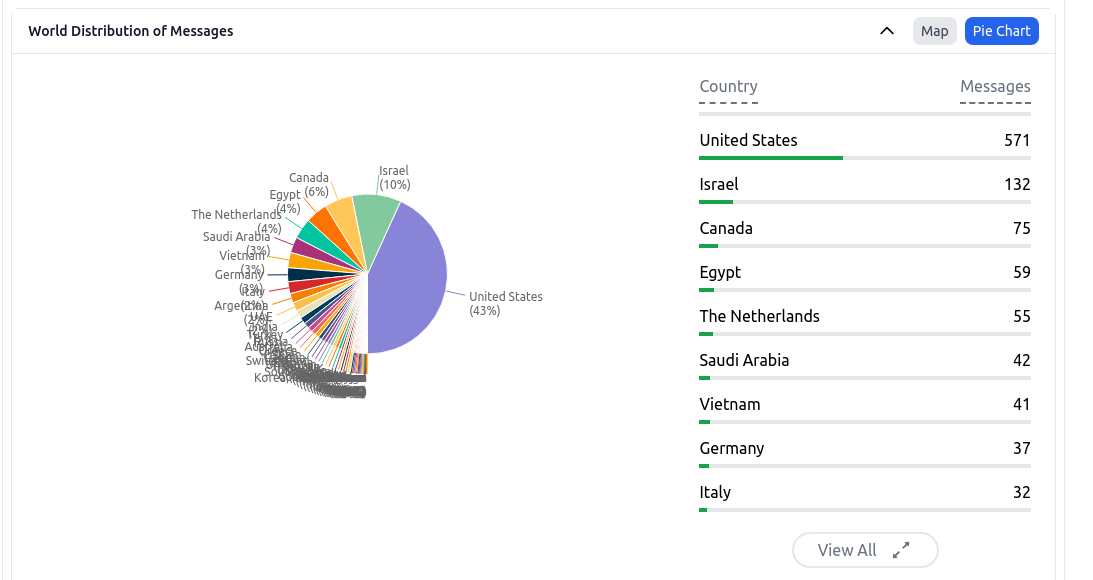
World Distribution of Chats
This graph displays the geographic distribution of users interacting with your chatbot, categorized by country over the selected period. 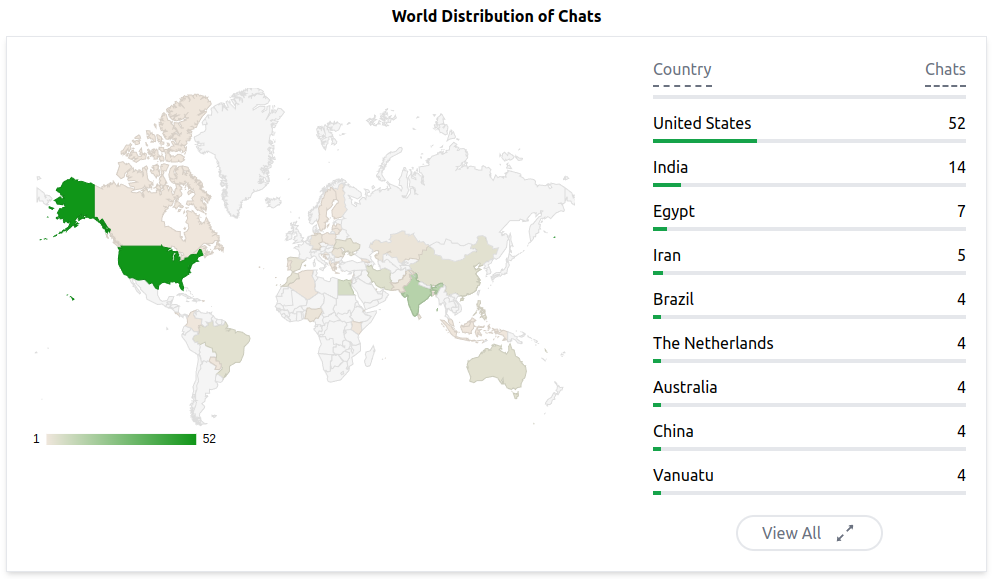
Bar Chart
